Wooly Worm Conclusion
A. The degrees of freedom used in the this exercise was 6.
B.
C. The calculated chi-square value is 40.06.
D. My results indicate that it wasn't chance alone that caused the equal numbers of capture wooly worm phenotype.
E.
B.
C. The calculated chi-square value is 40.06.
D. My results indicate that it wasn't chance alone that caused the equal numbers of capture wooly worm phenotype.
E.
Species Diversity Lab
1. Identify which parking lot you expect to be the most diverse, and defend your choice.
prediction in question #1 of the prelab was supported or not supported.
- I expect the Staff parking lot to be more diverse because the staff doesn't care about trends. Meanwhile, some students care about what car they get or they want similar cars like their friends.
prediction in question #1 of the prelab was supported or not supported.
-
Population Pyramids
Turlock, CA
The graph is
Los Angeles, CA
San Diego, CA
San Francisco, CA
Chicago, Illinois
Reno, Nevada
New York, New York
Climate.gov - Maps & Data
U.S. Drought Monitor
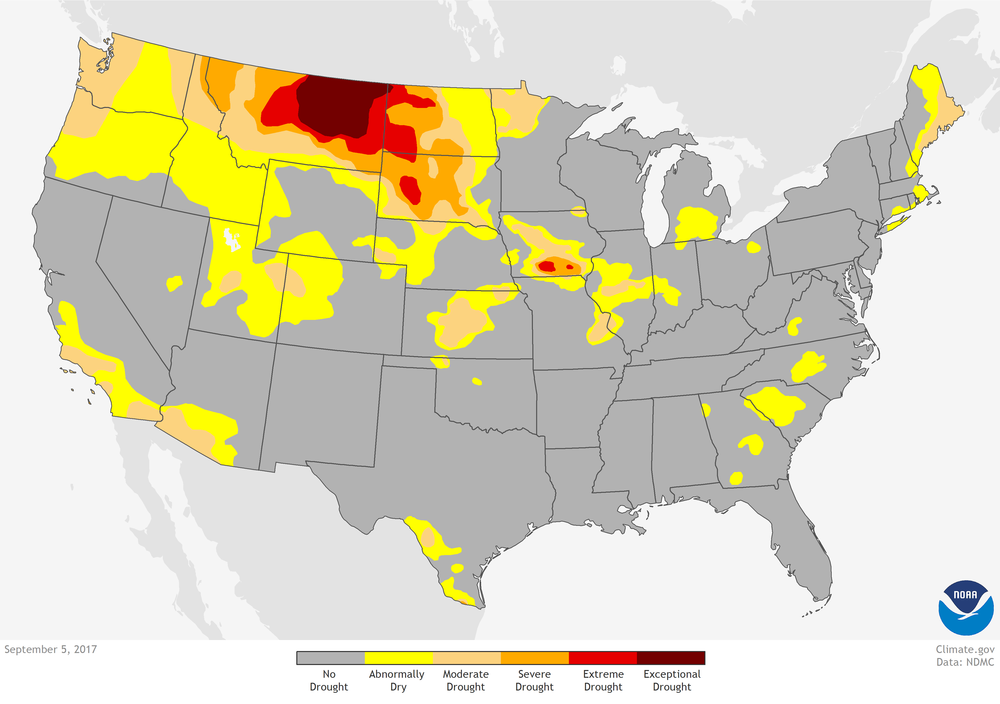
The graph is showing drought monitors across the United States.
The graph interests me because it can help me focus on what states need aid to be lifted from the drought.
The graph interests me because it can help me focus on what states need aid to be lifted from the drought.
Monthly Temperature Outlook
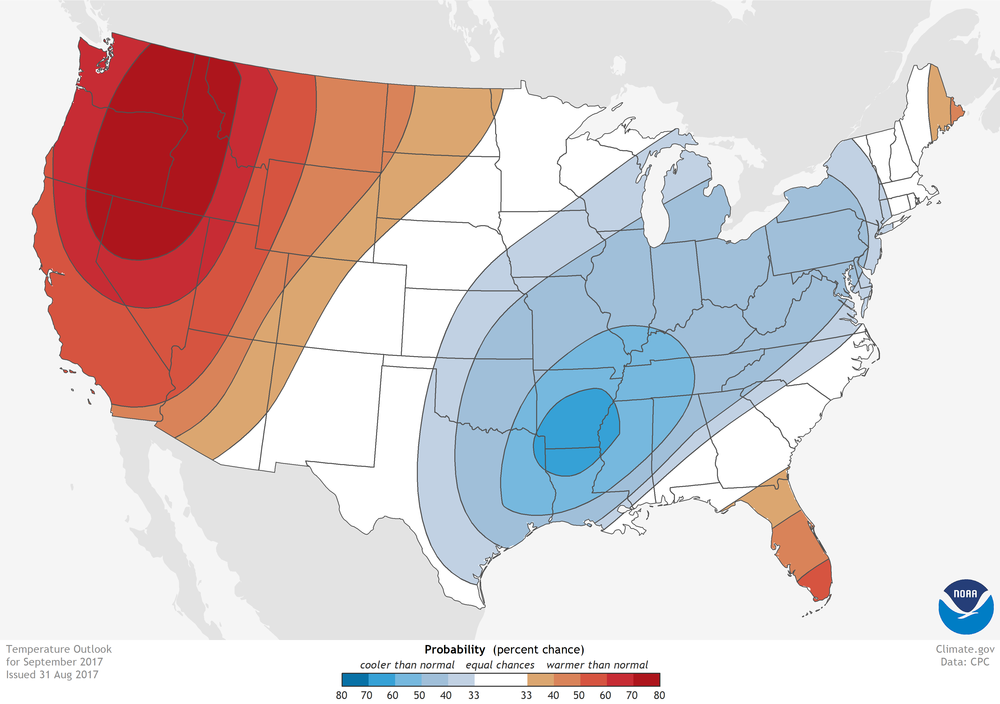
The graph is showing monthly temperature outlooks across the United States.
The graph interests me because I can see what states are hotter or cooler than other states.
The graph interests me because I can see what states are hotter or cooler than other states.
Total Precipitation
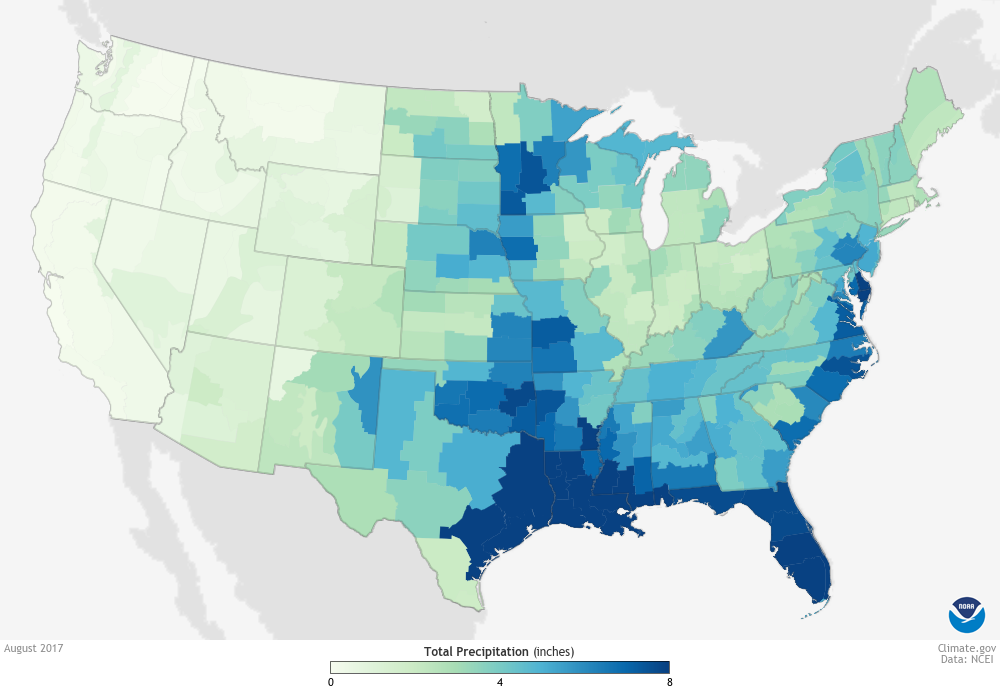
The graph is showing the total perception across the United States.
It interests me because I can see what states are getting more rain. I can also see what states are more likely to get flooded.
It interests me because I can see what states are getting more rain. I can also see what states are more likely to get flooded.
Ocean Heat Content
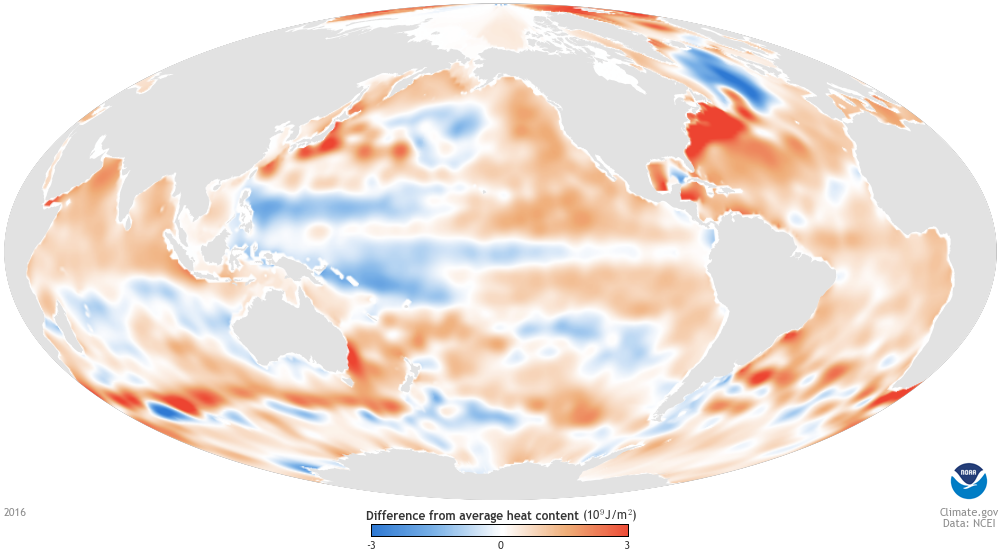
The graph is showing the heat contents on the ocean.
It interests me because I can see where hurricanes are more likely to form.
It interests me because I can see where hurricanes are more likely to form.
Average Monthly Temperature
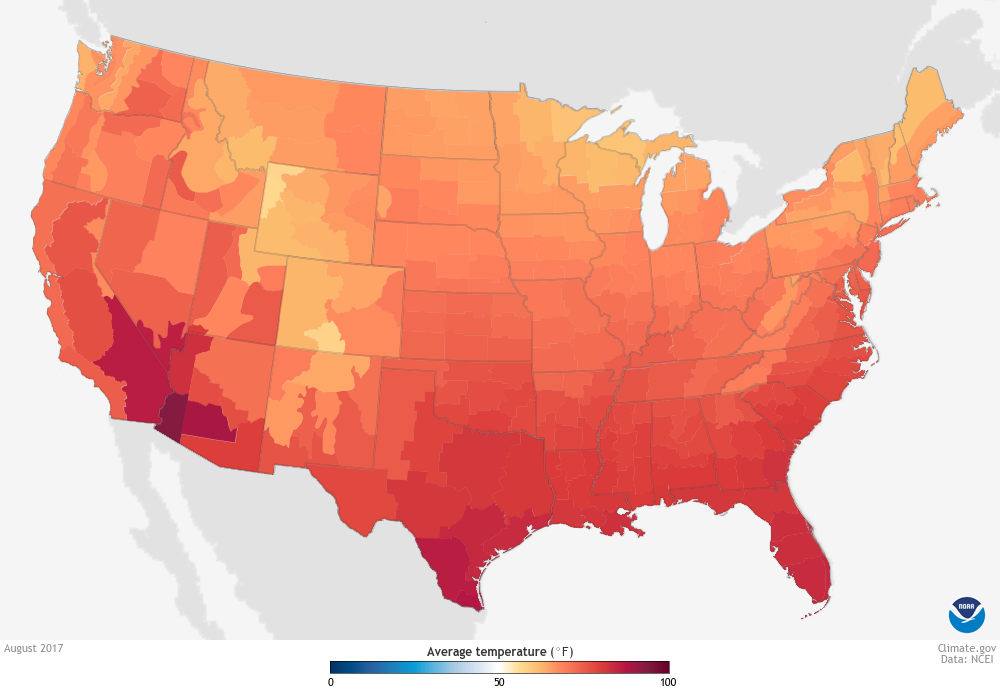
The graph is showing the average monthly temperatures throughout the United States.
It interests me because I can see how the temperatures are across the country but also I can see how global warming affectsregions that are supposed to be cold.
It interests me because I can see how the temperatures are across the country but also I can see how global warming affectsregions that are supposed to be cold.
